Snapshot allows the scheduler to instantly focus on projected KPI’s such as on-time deliveries, setup times, and other custom metrics. Snapshot leverages the power of Opcenter APS and allows the user to visualize the results of their actions. What differentiates Snapshot from other BI tools is the ability to show key indicators instantly as the schedule changes, allowing the scheduler to see if different rules and different actions reflect positively or negatively on the schedule.
Snapshot is a dashboard tool that makes Opcenter Scheduling more flexible by taking the power of the APS solution and allowing the user to visualize the results of their actions. Snapshot allows users to identify key indicators and show them as the Opcenter schedule changes, to see if different rules and different actions reflect positively or negatively on the schedule.
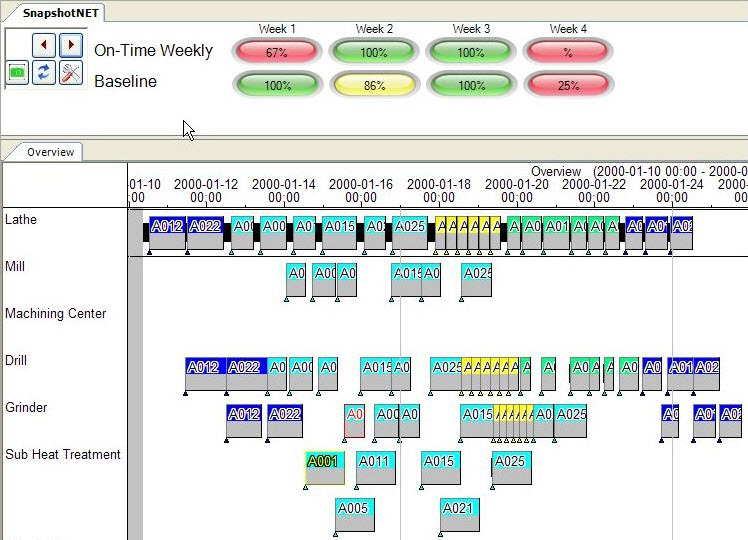
When a “snapshot” is taken, the current baseline indicator levels are recorded. As the new scheduling rules are applied, or other changes to the schedule are made, the results are instantly displayed. The baseline results are shown below them(or as a red needle in the dashboard view) for easy comparison between the baseline and the current results. Indicators are highlighted in red, yellow, or green based on the user defined parameters.
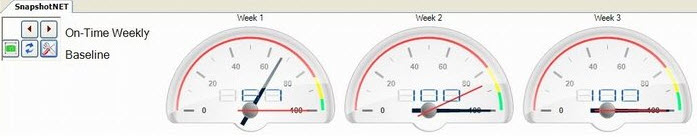
Or the results can also be viewed in a dashboard format:
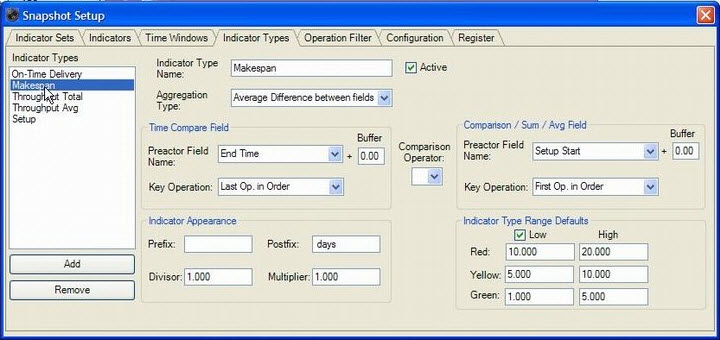
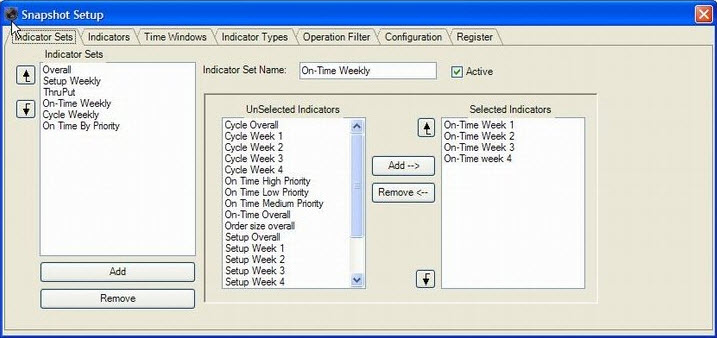
Because Snapshot was built specifically for Opcenter APS and is integrated directly into the Opcenter Scheduling Sequencer screen, it provides real time feedback as the schedule is changed. The professional version of Snapshot is fully user configurable.
An unlimited number of Indicator sets, indicators, indicator types, time windows, and operation filters can be produced.